Table of Contents
| quality Index scoring |
| symbol |
| value |
| calculated reference value |
| difference |
| rating |
| ATI recommends |
| recommendations |
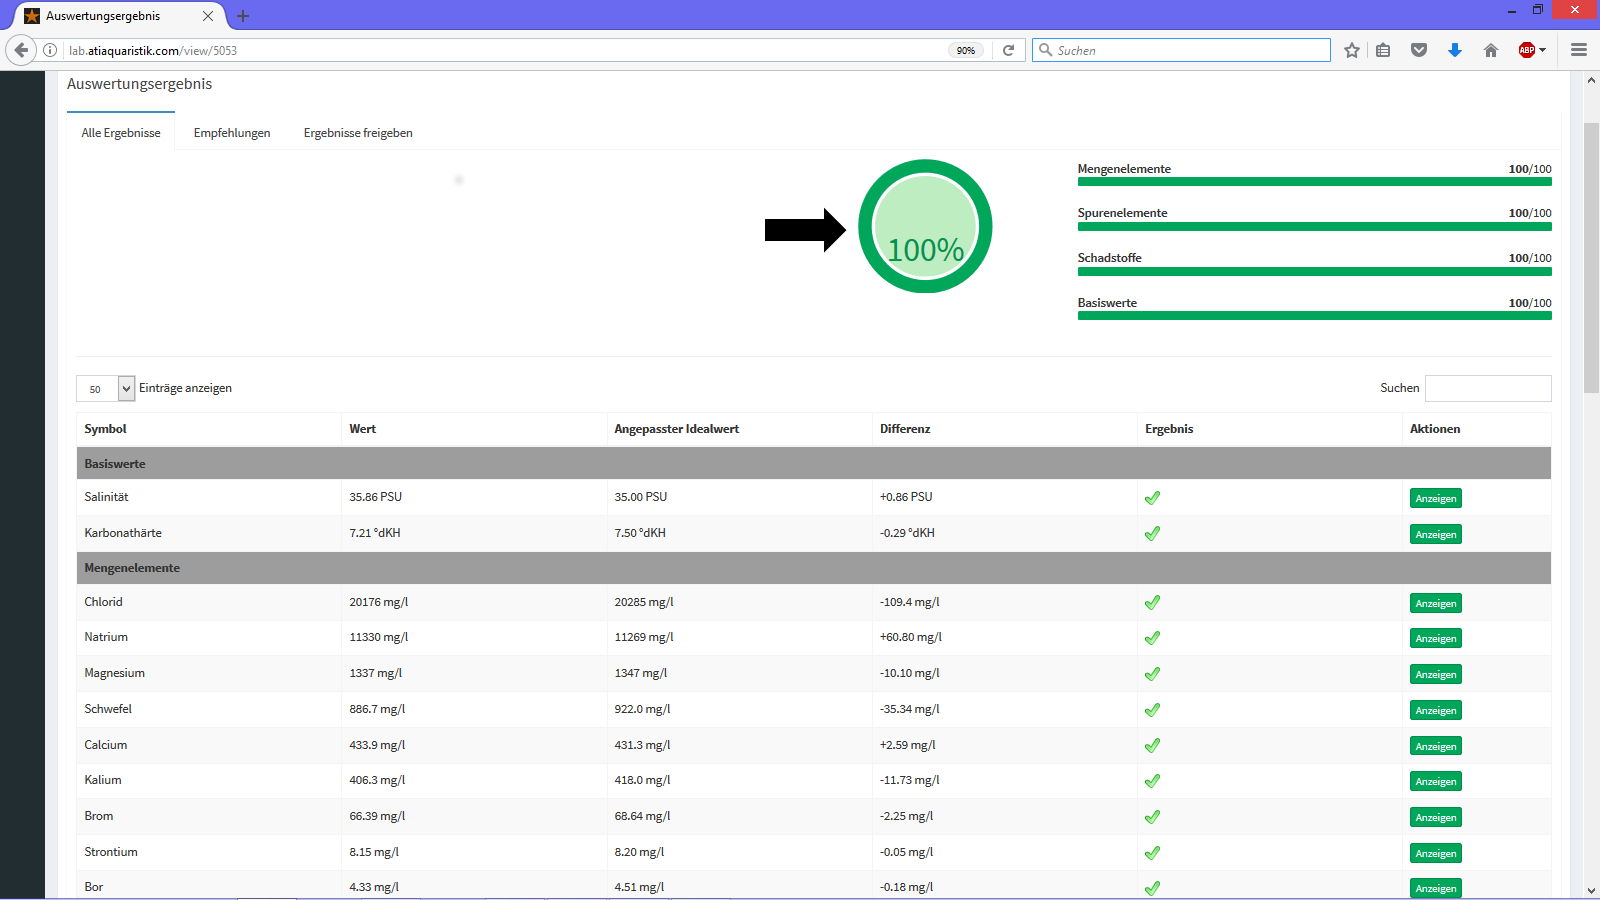
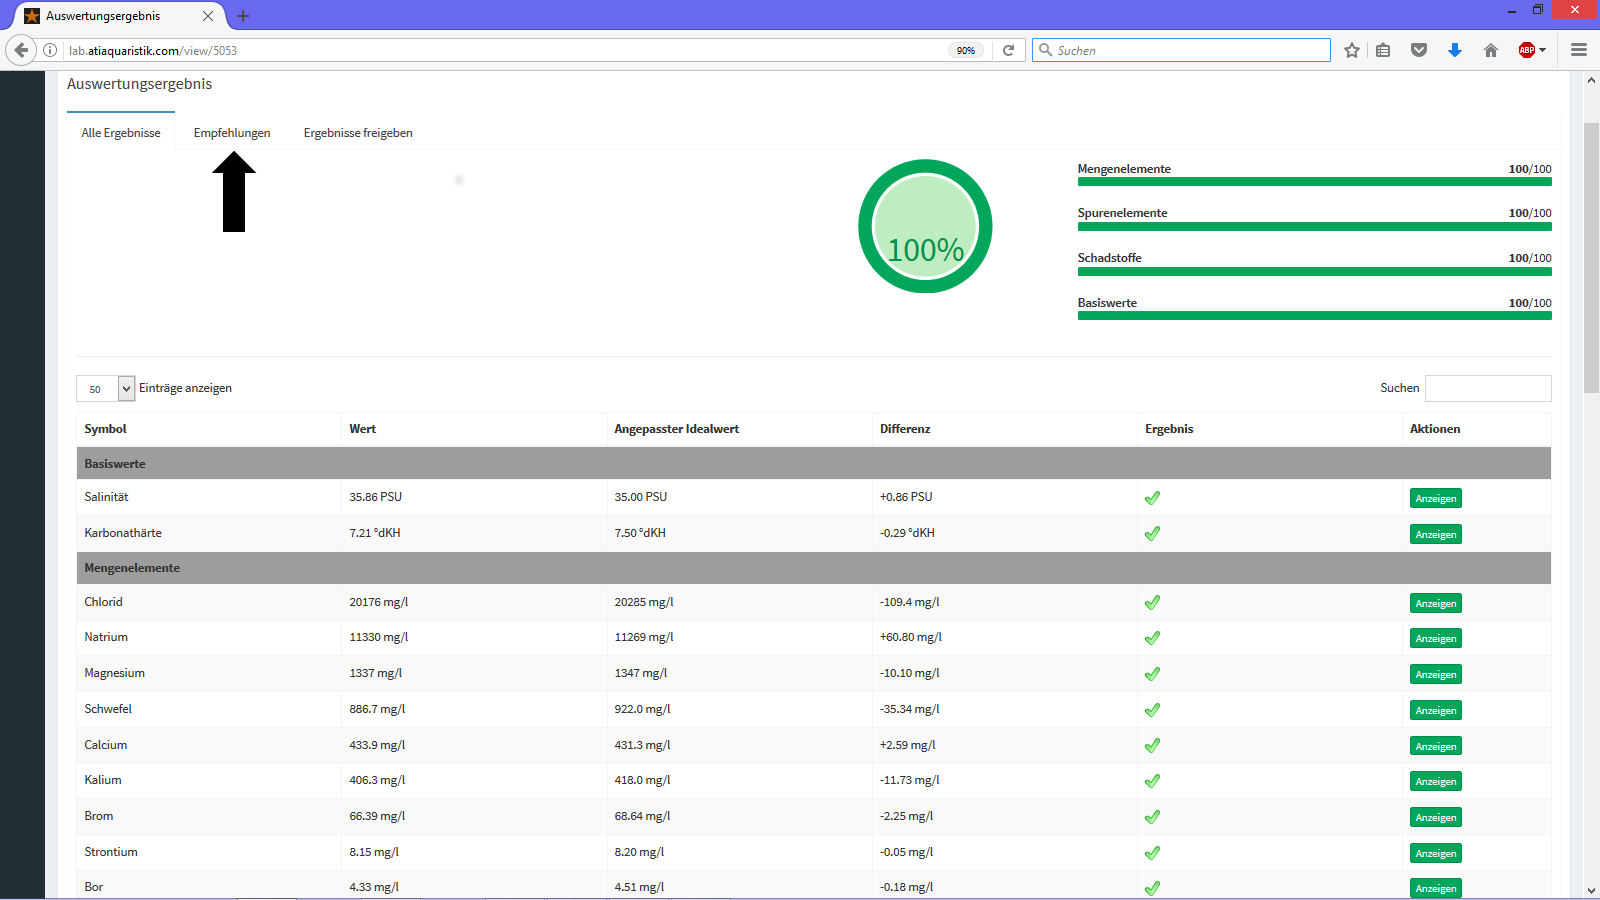
The quality index (see black arrow in the graphic below) is a combined overall rating of your water sample. The quality index (QI) is issued as a percentage. The higher the QI, the more natural the composition of the sample is (close to Natural Sea Water).
For the calculation of the QI the quantity data from the groups of elements, trace elements, pollutants and base values are used. Each group is assigned a score bar, which can be green (good) to red (bad) and thus provides quick and clear information about which group should be considered.
Info: Since many corals have different demands on the amount of nutrients dissolved in the water, the nutrients group is not included in the assessment. (PO4, NO3)
to the topSymbol
The symbols (see black arrow in the picture below) provide information on the name/identity of the measured value and its title in the group of basic values, base elements, mayor elements, trace elements, nutrients or pollutants.
to the topValue
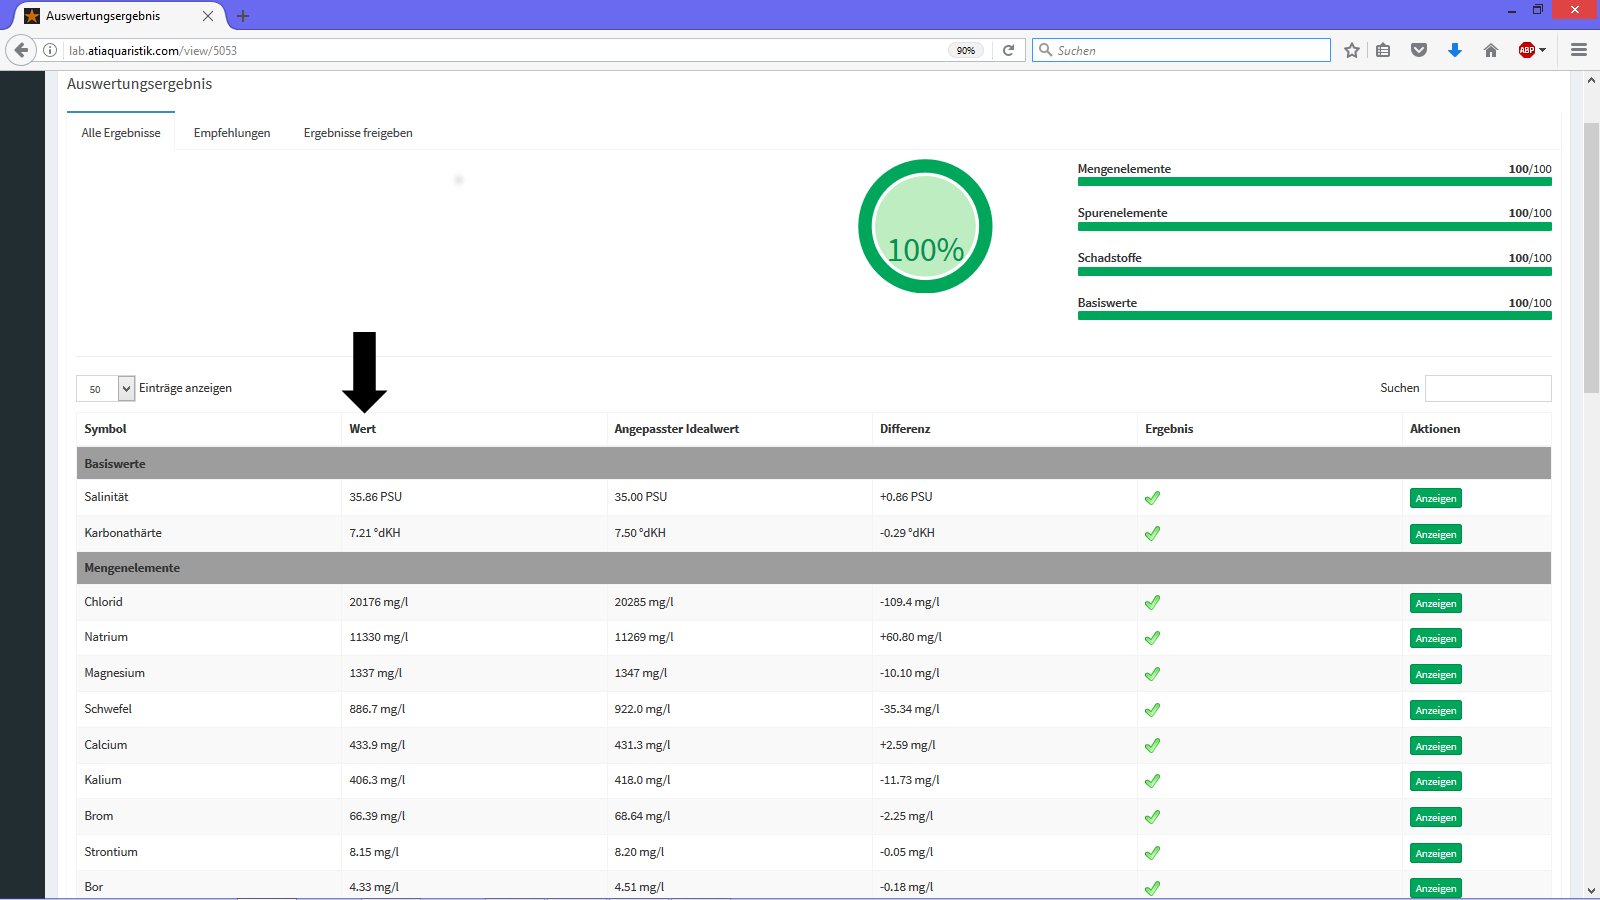
The column Value (see black arrow in the graphic below) contains what the measured values of your sample were.
to the topCalculated reference value
The Calculated reference values (see black arrow in the graph below) correspond to the ideal values depending on the measured salinity of your water sample, which we calculate for you from the concentration of sodium and chloride.
Info: : The concentrations of the elements dissolved in seawater are proportional to their salinity. In simple terms, this means that the higher the salinity of seawater, the more salts are dissolved in it and so the higher the concentrations of the individual elements should be. Further information can be found by clicking here
to the topDifference
The difference (see black arrow in the graphic below) indicates how much the measured value deviates from the Calculated reference value. Positive signs (+) indicate that the reading is above where it should. Values with a negative sign (-) indicate that its lower than it should be.
to the topRating
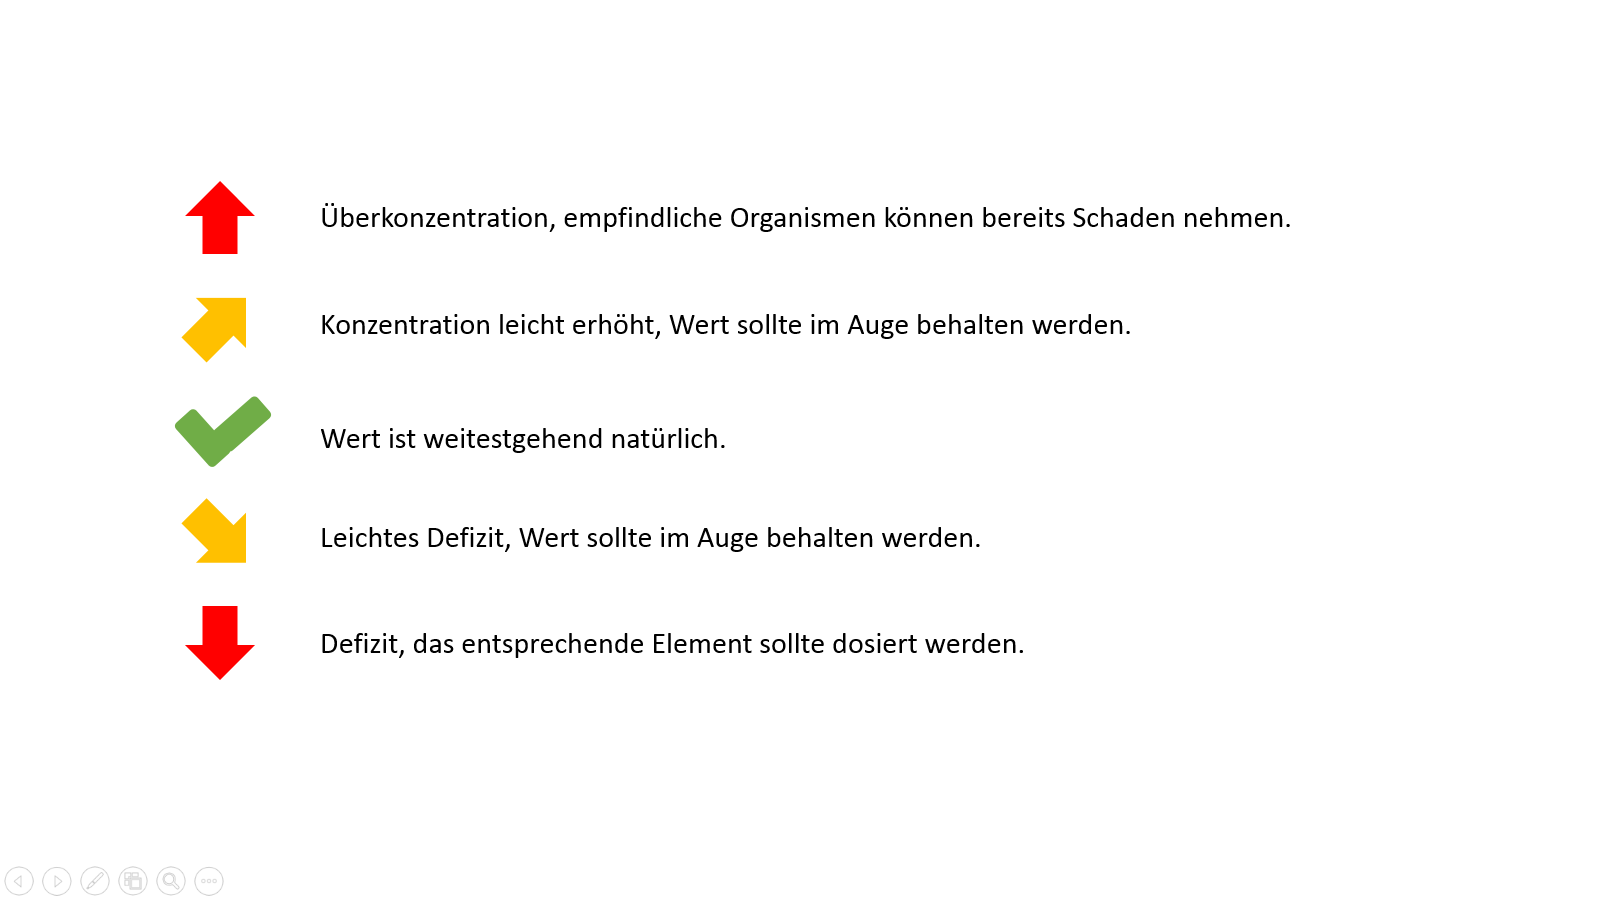
The rating (see black arrow in the graphic below) is directly related to the difference. A green tick indicates that the reading is in a near-natural range and that it is well tolerated by the various reef organisms. Arrows pointing up indicate over-concentration (values are too high). Arrows pointing down indicate a deficit (values are too low). A more detailed gradation can be found in the graphic below right.
to the topATI recommends
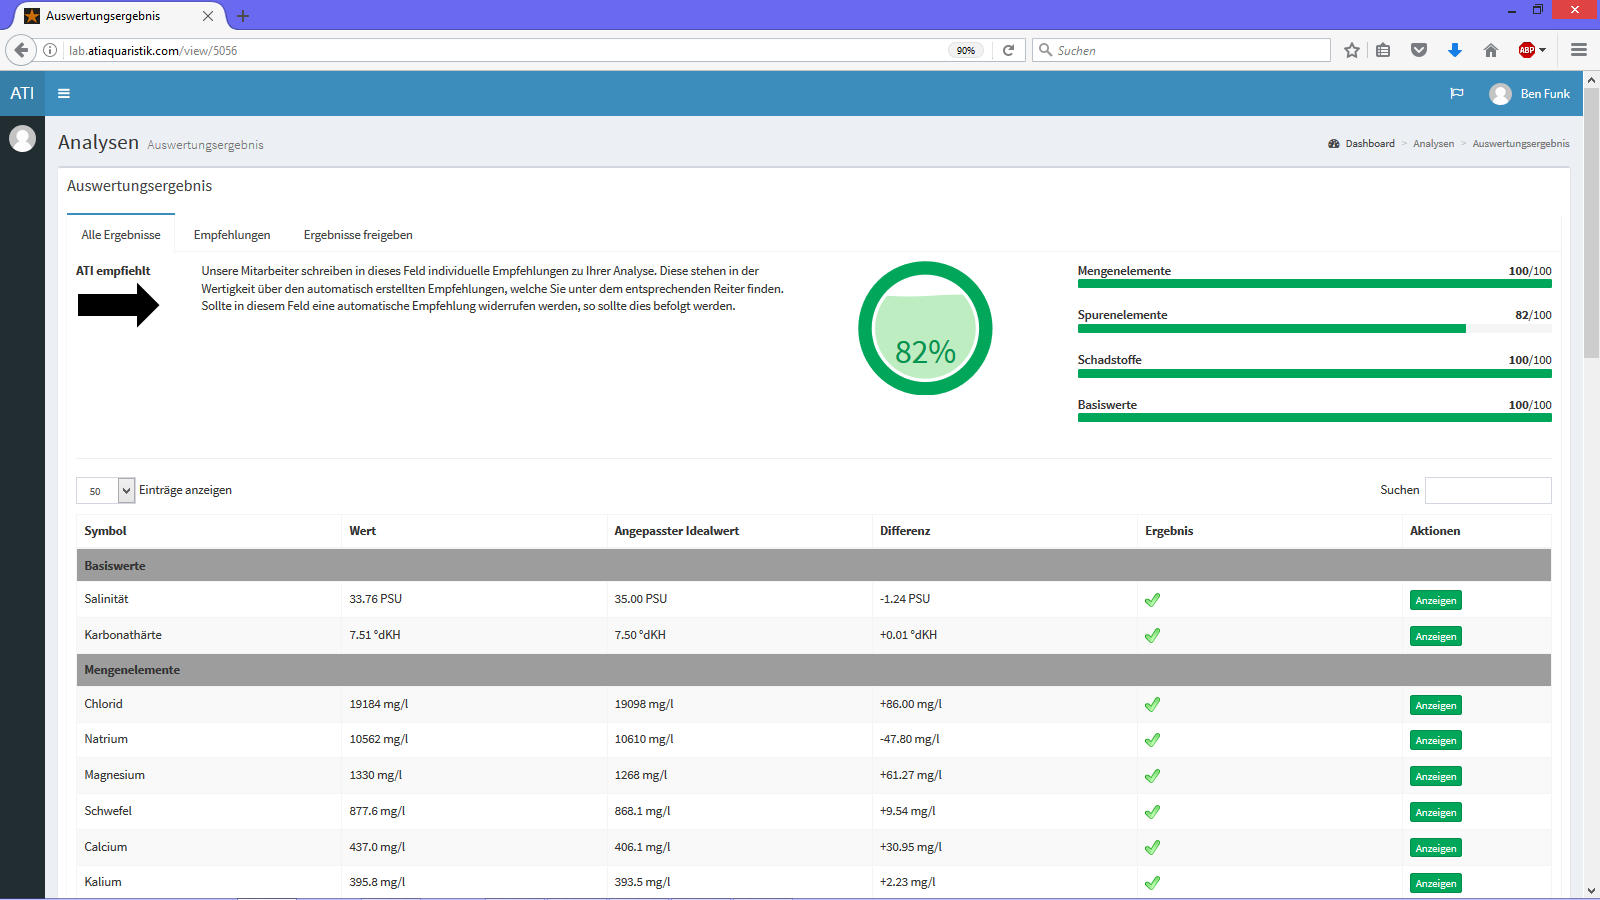
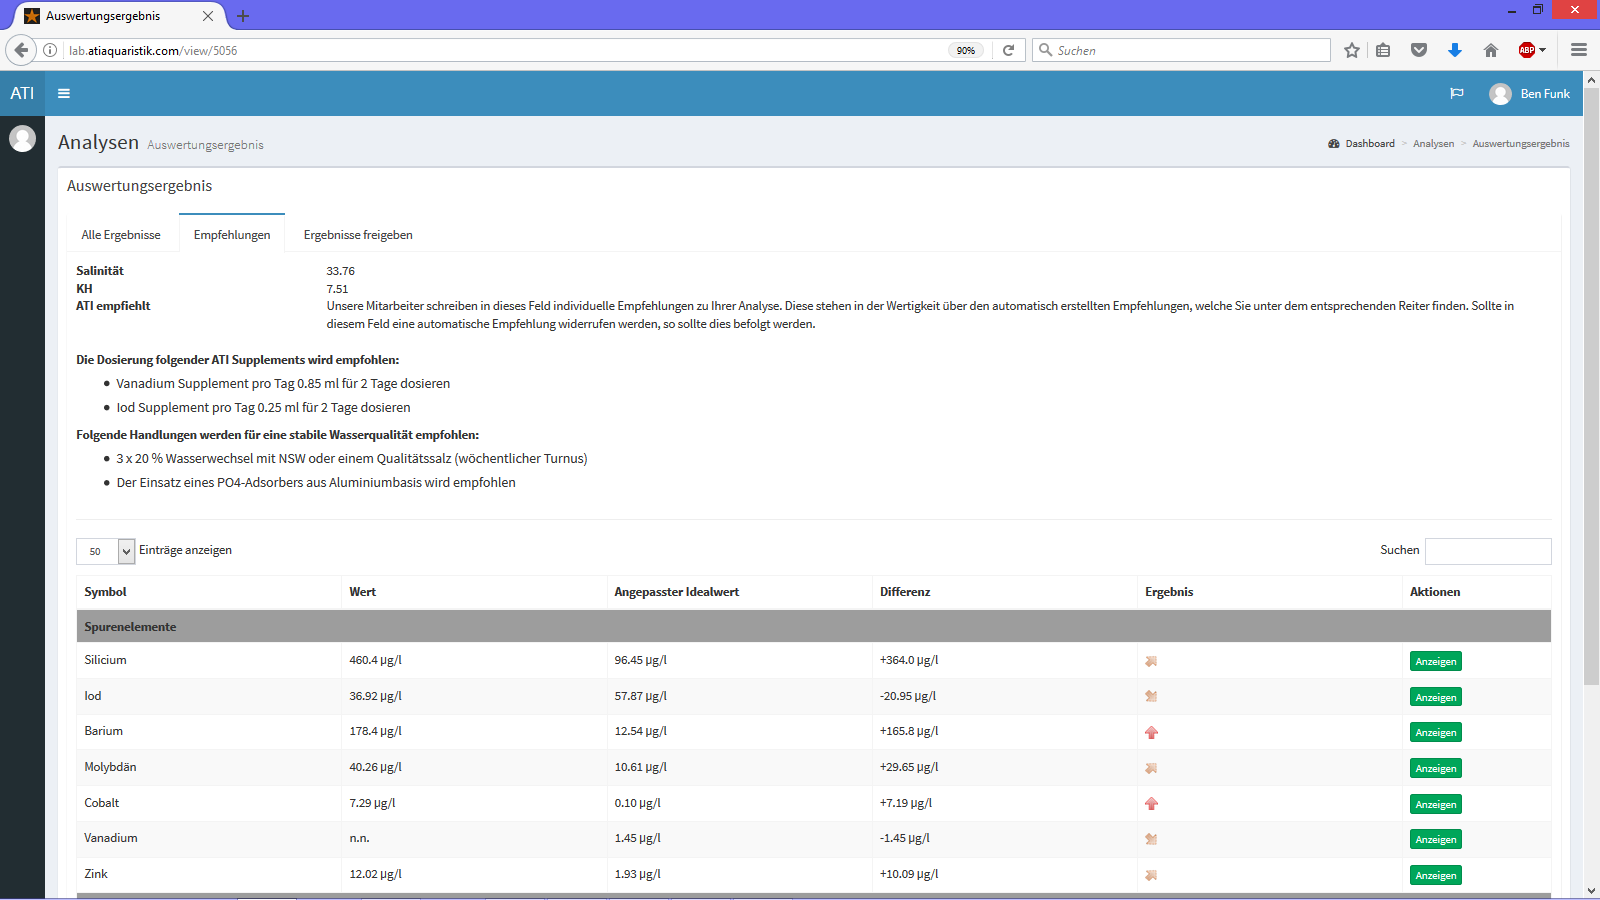
The ATI field recommends (see black arrow in the picture below) includes measures that are recommended individually for the correction of your aquarium water. These are recommendations generated by the system and are therefore only created if supplementary or deviating measures are needing attention or correction. Please do not be surprised if this field does not appear on every analysis.
to the topRecommendations
Our system evaluates your water sample according to our specifications and makes corresponding recommendations. Under the Recommendations tab (see black arrow in the graphic below) they can be called up. The printed PDF summarizes them on the last page. The overview of recommendations (see graphic below right) is divided into two divisions, dosing recommendations and corrective measures.
to the top
